articles/Paper/layingtrail-page5
Paper Chase - Laying the Trail - part 5 of 1 2 3 4 5 6 7 8 9 10
by Mike McNamee Published 01/04/2004

1. A greyscale based on the Kodak Q13 Swatch Target
2. The CMYK and RGB Primary Colours
3. The Highlights detector for determining differentiation in the pastel highlight colours, typical of some brides' and bridesmaids' gowns.
4. The Black Detector for identifying the RGB value at which shadow differentiation does not occur i.e. the point at which the shadows block up.
5. A monochrome image from a flat bed scan of a resin coated print.
6. Two images, courtesy of Fuji, which show typical skin tones. The black behind the Tulip Girl is almost fully dense, the black gloves of the other girl display the level of differentiation in the shadows.
7. Two feathered models courtesy of Epson. As well as perfect skin tones the bright feathers show the level of detail achieved by a print.
8. A very tanned bride and a lace dress for checking subtle highlight detail.
9. An Imacon scan from a 6x6cm negative.
10. A drum scan from a 6x6cm negative, hand corrected for colour.
11. A Kodak Professional PhotoCD scan from a Fuji 64T 6x6cm transparency
12. Warm dawn tones from a 35mm PhotoCD scan.
13. Kodak PhotoCD scan from a 400ASA transparency material
14. A straight digital image from a Nikon D100 in bright conditions.
15. A direct scan of autumn leaves placed on an Epson 2450 flat bed scanner.
16. A Kodak PhotoCD scan of a 35mm Fuji transparency.
17. A panoramic stitch from Nikon D100 images shot in cool dawn light.
18. Block 1. The earth/landscape tones ranging from rich warm red and browns to yellows and foliage colours. A set of sky colours is shown in the bottom row.
19. Block 2. The full range of common found skin tones. All are at typical white Caucasian Lightness values with a full sweep of hues and saturations.
20. Block 3. A full range linear grey scale.
21. Block 4. The Colours of the Macbeth Colour Checker.

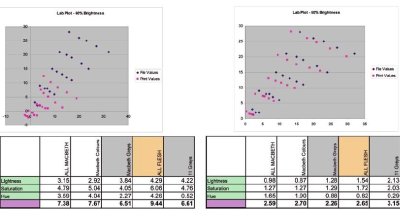
We know from the data that our test bed 2100 and 7600's perform somewhere in the middle of the expected range and therefore any variations we see with non-Epson paper is due to the reaction between the paper and the driver. We should therefore be able to give general guidelines as to the corrections that might be applied in the printer driver to bring a print back to neutrality. The reason that papers bias the image in different ways is to do with differences in the rate of diffusion of the different inks into the substrate. There is a chemical analysis method called thin layer chromatography which exploits this to effect and the writer can still recall an experiment at the University of Liverpool, when he was a schoolboy visitor, in which they took fountain pen ink (Biros were banned at the time, that's how long ago we're talking!) mixed in some gunge or other and then dipped a chalk coated glass slide into the gunge. After a few minutes, the black ink had separated into its constituent pigments (blues, greens and blacks from memory) as they were crawling up the glass slide at different speeds. If an icc profile is made for an ink/paper combination, the differences in diffusion are taken account of - change the ink or the paper and all bets are off - if the cyan moves faster into the substrate it leaves the image biased towards the complementary colour (ie more red).
Please Note:
There is more than one page for this Article.
You are currently on page 5
- Paper Chase - Laying the Trail page 1
- Paper Chase - Laying the Trail page 2
- Paper Chase - Laying the Trail page 3
- Paper Chase - Laying the Trail page 4
- Paper Chase - Laying the Trail page 5
- Paper Chase - Laying the Trail page 6
- Paper Chase - Laying the Trail page 7
- Paper Chase - Laying the Trail page 8
- Paper Chase - Laying the Trail page 9
- Paper Chase - Laying the Trail page 10
1st Published 01/04/2004
last update 09/12/2022 14:55:40
More Paper Articles
There are 0 days to get ready for The Society of Photographers Convention and Trade Show at The Novotel London West, Hammersmith ...
which starts on Wednesday 15th January 2025


